This release is a big performance push. We shipped incremental rendering for the space viewer, smarter re-render logic across the board, and promoted facade-based rendering to the default in the app. For smplr.js integrations, facade mode becomes the default in v3.
🚀 Performance
The space viewer now renders spaces incrementally: when something changes, only the affected parts are rebuilt rather than the entire scene. In the app, this makes level switching and live edits noticeably faster on large, multi-level buildings, and opens the door to incremental loading for faster initial renders.
Facade-based rendering is now the default in the app, delivering faster initial loads and quicker level switches on large spaces. In smplr.js, this will become the default in v3. To prepare, pass
disableFacadeMode: falseto opt in early, ordisableFacadeMode: trueto preserve the current behavior after upgrading. TheexperimentalFacadeBasedPerformanceoption is deprecated in favor ofdisableFacadeMode. Learn more in the docs.The viewer no longer delays every render by 300ms or shows a progress indicator for simple changes. We now evaluate the complexity of each change upfront: simple ones apply immediately with no interruption, while complex ones trigger the progress indicator before the heavy work begins, keeping the interface responsive.
Mode and filter changes no longer freeze the page when a dense sphere heatmap data layer is active.
We fixed memory leaks in the viewer that could accumulate over long-running sessions.
🎉 New features
You can now generate an entire bank of parking bays in one step. In the 2D editor, go to the Advanced tab, choose Add parking, pick three corners to define the area, and set your parameters: number of bays, bay width, angle, and single or double rows. You can re-edit or delete a cluster at any time, and extract the bays as mapped polygons in the Entity Manager.
You can now attach custom key-value properties to any editor feature: walls, grounds, roofs, stairs, objects, annotations, doors, and windows. Properties support text, number, and boolean values, are available under "Advanced" in the properties panel, and persist with the space. Use them to tag features with asset IDs, equipment specs, or any data your application needs.
Desk and seminar seating clusters are now re-editable. Click any desk, or right-click any seat, to reopen the original configuration, adjust it, and regenerate the layout, or remove the entire cluster.
You can now copy a space's map location and paste it directly onto another space from the space location panel.
The
listSpacesquery client method now returns floor area and project membership for each space, making it easy to build portfolio dashboards, track area usage per project, and enforce client allowances. You can also filter by project, request a per-level area breakdown, and choose your area unit (sqmorsqft). Learn more in the docs.
💅 Improvements
The space profile now shows a single, stable loading cover while a space loads, replacing the previous sequence of flashing pill indicators. The cover lifts as soon as the initial render is ready, letting equipment stream in progressively.
If you embed the space viewer in your own app, you can implement the same behavior using the new
onPartialRenderReadycallback: it fires as soon as the space shell is rendered, letting you lift your own loading cover at the same moment. Learn more in the docs.
🐛 Bug fixes
We fixed an issue where holding Ctrl to pan the canvas while drawing a polygon entity mapping would also unintentionally drag the polygon.
We fixed a bug where completing a hole polygon by clicking on a ground corner would automatically start drawing a new hole.
We fixed an issue that could occur when calling
addDataLayer,updateDataLayer, orremoveDataLayerafter the viewer had been stopped.We fixed an issue where data layers with tooltip templates could fail silently in the 3D viewer and map viewer.
🎉 New features
You can now choose between a map viewer and a space viewer when creating a project, and change it at any time from project settings.
Map projects now support a configurable default camera placement. Set, preview, and clear it directly from project settings.
In the equipment editor, you can now move, elevate, and rotate multiple items at once. Select them all and use the properties panel to shift their position, adjust elevation, or rotate them by the same amount while keeping their relative arrangement intact.
💅 Improvements
Satellite imagery is always available on map projects.
We polished the experience following the recent billing account launch, with minor fixes and visual refinements across the billing pages, org switcher, and analytics section.
🐛 Bug fixes
We fixed a bug where space pins were not showing on the project overview map.
We fixed a rendering issue in the 3D viewer where windows on very tall buildings would disappear when zooming out, making the building appear to have no exterior walls.
⚙️ Groundwork
We have reworked how the 3D viewer manages state internally, improving type safety and reliability. This lays the groundwork for upcoming performance improvements, including incremental rendering for faster initial loads on large spaces.
Bug fixes
We fixed a regression from v2.57.0 in the space viewer's preview mode where the onReady callback could fire before the space had finished loading, which could break integrations calling methods such as addDataLayer too early.
📣 Announcement
Full visibility into what you're running, and what it's costing you 🔍
Billing accounts started as a way to consolidate billing, but this release turns them into something bigger: one place to see everything you run and what it's worth to keep.
A billing account can now link several organizations together, useful for a company organized into multiple business units, or for anyone managing organizations on behalf of several clients. The organization switcher has been reworked around this: a redesigned Organizations tab shows each organization's space count, a clear highlight for the one you're currently in, a quick menu to jump to its people or settings, and a flag on any organization that has hit its free space limit. A new Billing tab sits alongside it, listing every billing account you belong to and the organizations linked to each, and letting you set one up or link an org in a couple of clicks.
Sandbox organizations, introduced a few releases back as part of this same effort, give every billing account a dedicated space to test, demo, and experiment without touching production data or counting against your free tier or usage metrics. They're now fully woven into the billing workflow, and every space inside a sandbox organization displays a persistent banner in the viewers marking it as not for production use.
The new Billed spaces tab is where the spend conversation happens. It lists every space tied to a billing account with its size, renewal date, and paid until status, so you always know what's coming up. Archive a space ahead of time if you want to trim costs before it renews.
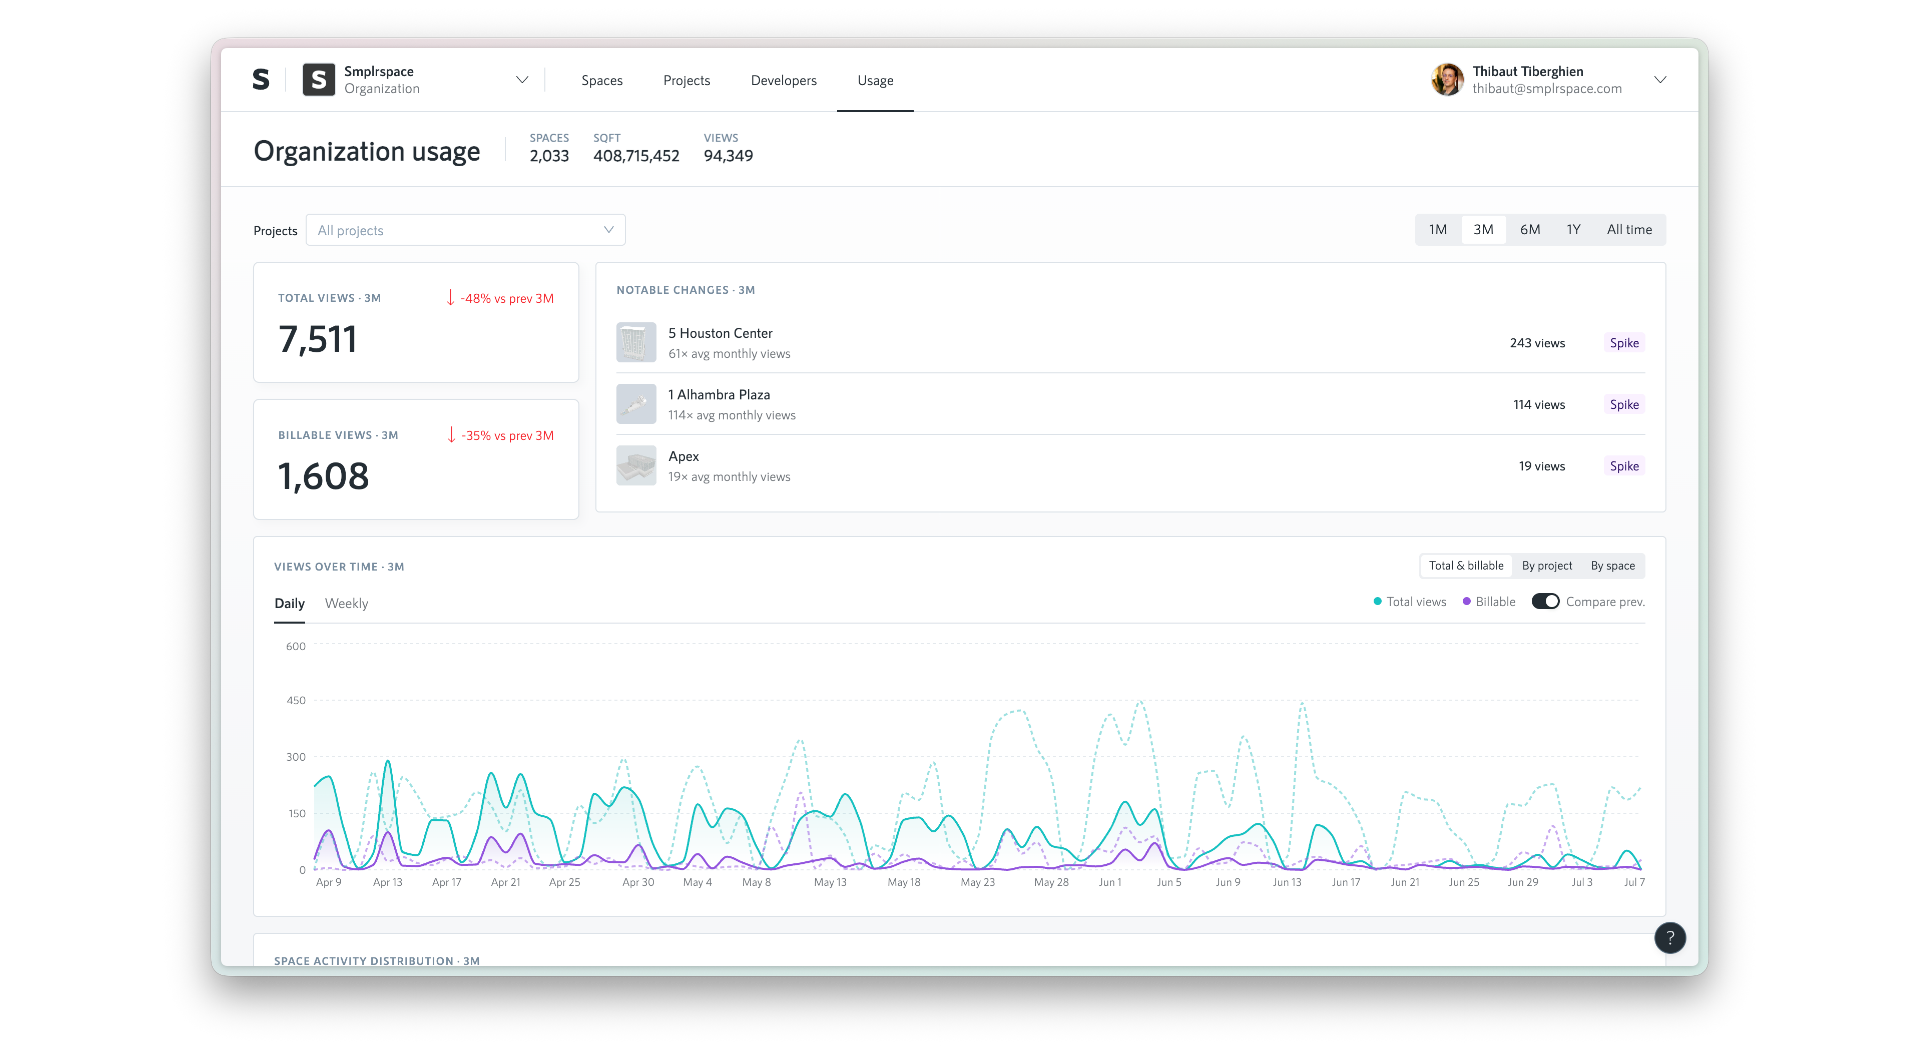
Usage analytics tie it all together, available at both the organization and billing account level. See total and billable views over time, day by day or week by week, compared against the previous period, spot notable spikes across your spaces, and break it all down by project or by space for the full picture.
Together, these give small teams a way to keep spend lean, and give larger operators running many organizations one place to see usage and impact across all of them, whether that's an ops lead, a portfolio manager, or a finance team that isn't in Smplrspace day to day.
🎉 New features
Until now, Projects was available to enterprise organizations only. It's now generally available to every organization. Group your spaces into a project for scoped access tokens and analytics, plus a map-based portfolio view, and for enterprise customers, an opt-in reporting environment.
You can now archive projects, just like spaces. Archived projects are hidden from your projects list by default, can be found with the new status filter, and can be unarchived anytime from the project settings.
You can now transfer a space between any of your organizations on the same billing account, not just from your personal account. Transfers move the space by default, with the option to keep a copy in the original organization.
You can now convert coordinates between geographic positions (longitude and latitude) and a space's local coordinate system in both directions, directly from the smplr.js SDK. This makes it straightforward to place geo-referenced data onto your floor plans, and to project local positions back onto a map. See the QueryClient geometry docs for the full reference.
Three editor updates come together to make glass facade walls dramatically faster to digitize:
You can now duplicate a window to all empty segments of a multi-segment wall in one action. Select a window and use "Add to all segments" from the right-click menu or the properties panel.
You can now expand a window to fill its entire wall segment in one action. Right-click a selected window and choose "Expand to segment", or press E. Combine it with "Add to all segments" and a facade wall goes from empty to fully glazed in two clicks.
You can now set a target panel width on multi-panel windows. The number of columns adjusts automatically to keep each panel close to that width, and re-adjusts as you resize the window.
We've dreamed about this one for a while, and it's finally here: natural, cursor-anchored zoom in the 2D editor. Scroll or pinch to zoom exactly where your cursor lands, pan by holding Shift while two-finger scrolling, drag in move mode, or use two fingers on a touchscreen.
💅 Improvements
Space.startViewer now calls your onReady callback in preview mode, so you can detect when the preview has finished loading without a workaround.
Space cards in your space list now display the number of levels in each space, in place of the total views count.
You can now see keyboard shortcuts right where you work in the editor. Contextual menus and action buttons show their shortcut next to each action, and a new keyboard shortcuts reference, opened from the help panel or by pressing ?, lists every shortcut organized by area.
The map viewer now respects white label settings: the "Powered by Smplrspace" attribution is hidden for white-label plans.
🐛 Bug fixes
We fixed an issue where the 3D viewer camera could center away from your space, which happened when a level had no ground and your space used coordinates far from the map origin.
We've fixed a rare issue where the spaces list could fail to load on very narrow screens.
Clearing the name of an editor item (window, door, wall, ground, roof, or stairs) no longer leaves two items showing the same name. When you clear a name, a fresh automatic name is generated.
We've fixed ground numbering in the editor. Adding grounds on a new level no longer skips numbers.
We've restored the type labels (e.g., shell, sliding) shown next to walls and doors in the component tree.
We've fixed an issue in reports where spaces with multiple stitch values in their entity field were silently not showing up. You can now use "|" as an OR separator on the entity side (e.g. "RoomA|RoomB"), while "+" continues to work for AND.
We've fixed an issue in reports where stitch fields pointing to custom extras columns were not resolving correctly. And the entity ID field can now also be referenced as "smplrUuid" in addition to "id", matching the CSV export.
🎉 New features
Our digitization order system (currently in private beta) now supports space update jobs. From the intake form, you can select which levels need their layout, equipment, or entities updated — with live pricing based on the area and work involved, and a dedicated pricing table on the job page.
💅 Improvements
Windows, doors, walls, grounds, roofs, and stairs now get a stable name the moment they're added — deleting one no longer renumbers the rest. They also sort alphabetically in the left panel, so new elements always appear at the bottom.
You can now drag and drop levels to reorder them in the digitization order system.
🐛 Bug fixes
We've fixed a bug where splitting a wall gave both segments the same name. Grounds and stairs now also get unique names when copied to another level.
💅 Improvements
You can now send a password reset email to any member directly from the organization's members list.
🐛 Bug fixes
We fixed an error that was preventing certain users from being invited to an organization.
⚙️ Groundwork
We're continuing to migrate to billing accounts to support clearer visibility into usage and renewals — more improvements coming soon.
🎉 New features
You can now create a sandbox organization linked to your billing account — a dedicated space for development and testing that won't affect your billing or metrics. Sandbox orgs are fully functional for embedding, with a persistent visual indicator so you always know when you're working in sandbox mode.
🐛 Bug fixes
We've fixed a bug where saving billing account settings would navigate to an error page instead of staying on the settings page.
We've fixed an issue where setting a space location in certain territories (such as Puerto Rico) could prevent the location from being saved.
⚙️ Groundwork
We've made significant under-the-hood changes to our billing infrastructure to support the new billing accounts model — the foundation for upcoming billing and subscription management features.
⚙️ Groundwork
We've moved our digitization jobs admin workflow to a dedicated internal tool, so we can iterate faster and bring an improved service experience sooner.
🐛 Bug fixes
We've fixed an issue where the
onPickcallback could returnNaNcoordinates when clicking on certain polygon walls with complex shapes.
⚙️ Groundwork
The digitization job order system is coming together nicely, with several backend and workflow improvements landing this release.
🎉 New features
We've upgraded BabylonJS, our 3D rendering engine, to version 9 — and the first thing this unlocks is WebGPU rendering, now available as an opt-in for the floor plan viewer. Set
webGpuOptIn: truein your viewer options to enable it (see the docs); we'll fall back to WebGL automatically if WebGPU isn't supported. WebGPU now runs in ~78% of browsers (up from less than 50% two years ago when we first evaluated it) and delivers a different performance profile from WebGL — real-world results vary by scene and hardware. We're keeping it opt-in so you can test it in your own context and share your observations at support@smplrspace.com; your feedback will shape how we roll this out further.Resizing equipment in the editor now works from one side by default — drag a handle and the equipment extends in that direction, keeping the opposite edge fixed. Hold Opt (Mac) or Ctrl (Windows) to resize symmetrically from the center instead. We've also improved the handles: they highlight in yellow on hover, stay a consistent size while dragging, and hide while you drag to reduce clutter — the rotation ring is now thicker and blends naturally into the 3D scene. Together, these changes make resizing and repositioning equipment significantly more precise and fluid — the kind of control you'd expect from a polished layout tool.
We're testing a new levels management experience, starting with drag-and-drop reordering — more improvements to come. It's in private beta; reach out if you'd like early access.
We've added an
onRightClickcallback to all data layers in the space viewer and map viewer, matching the existingonClicksignature — right-clicking a data element fires the callback and suppresses the browser's default context menu. More details in the space viewer and map viewer api reference.You can now set up a billing account directly from organization settings — add your legal entity details, billing contacts, and link multiple organizations to the same account when you're ready to move past the free tier.
The Excel export button is now available on map report pages.
💅 Improvements
Tree category selections are now correctly reflected in the Excel export filter summary.
🐛 Bug fixes
We've fixed an issue where resizing a table and chairs set with "Seats on one side" enabled would produce incorrect table dimensions.
We've fixed stale floor plan geometry showing in the entity manager after publishing from the editor.
We've fixed a crash that could happen when moving the canvas while a floor plan element was being placed.
We've fixed an issue where clearing a dimension in bulk edit (e.g. wall height) wasn't being applied, preventing elements from reverting to their space defaults.
We've fixed secondary data layers in reports not clearing when switching months.
We've fixed the onboarding tip banner overlapping the editor's navigation bar and blocking the page and level selectors.
We've fixed a drift issue when resizing furniture with attached elements — desks with chairs, tables with one-side seating, chairs, and shelves with doors — where the object would shift position after each resize.
We've fixed a recurring error that could silently crash parts of the app when going offline mid-session or logging out.
We've fixed the Excel export on aggregated-stats report pages — the Summary sheet was crashing or exporting empty for some configurations.
We've fixed an issue where publishing a space containing an empty level would fail.
⚙️ Groundwork
We've started building the analytics foundation — space view data is now aggregated nightly, laying the groundwork for fast analytics dashboards.